
When it comes to CEO compensation, conventional wisdom suggests that higher pay attracts better talent and drives stronger performance. But CEORater's analysis of S&P 500 CEOs tells a different story—one where the executives taking the least often deliver the most.
Founder CEOs
All CEOs
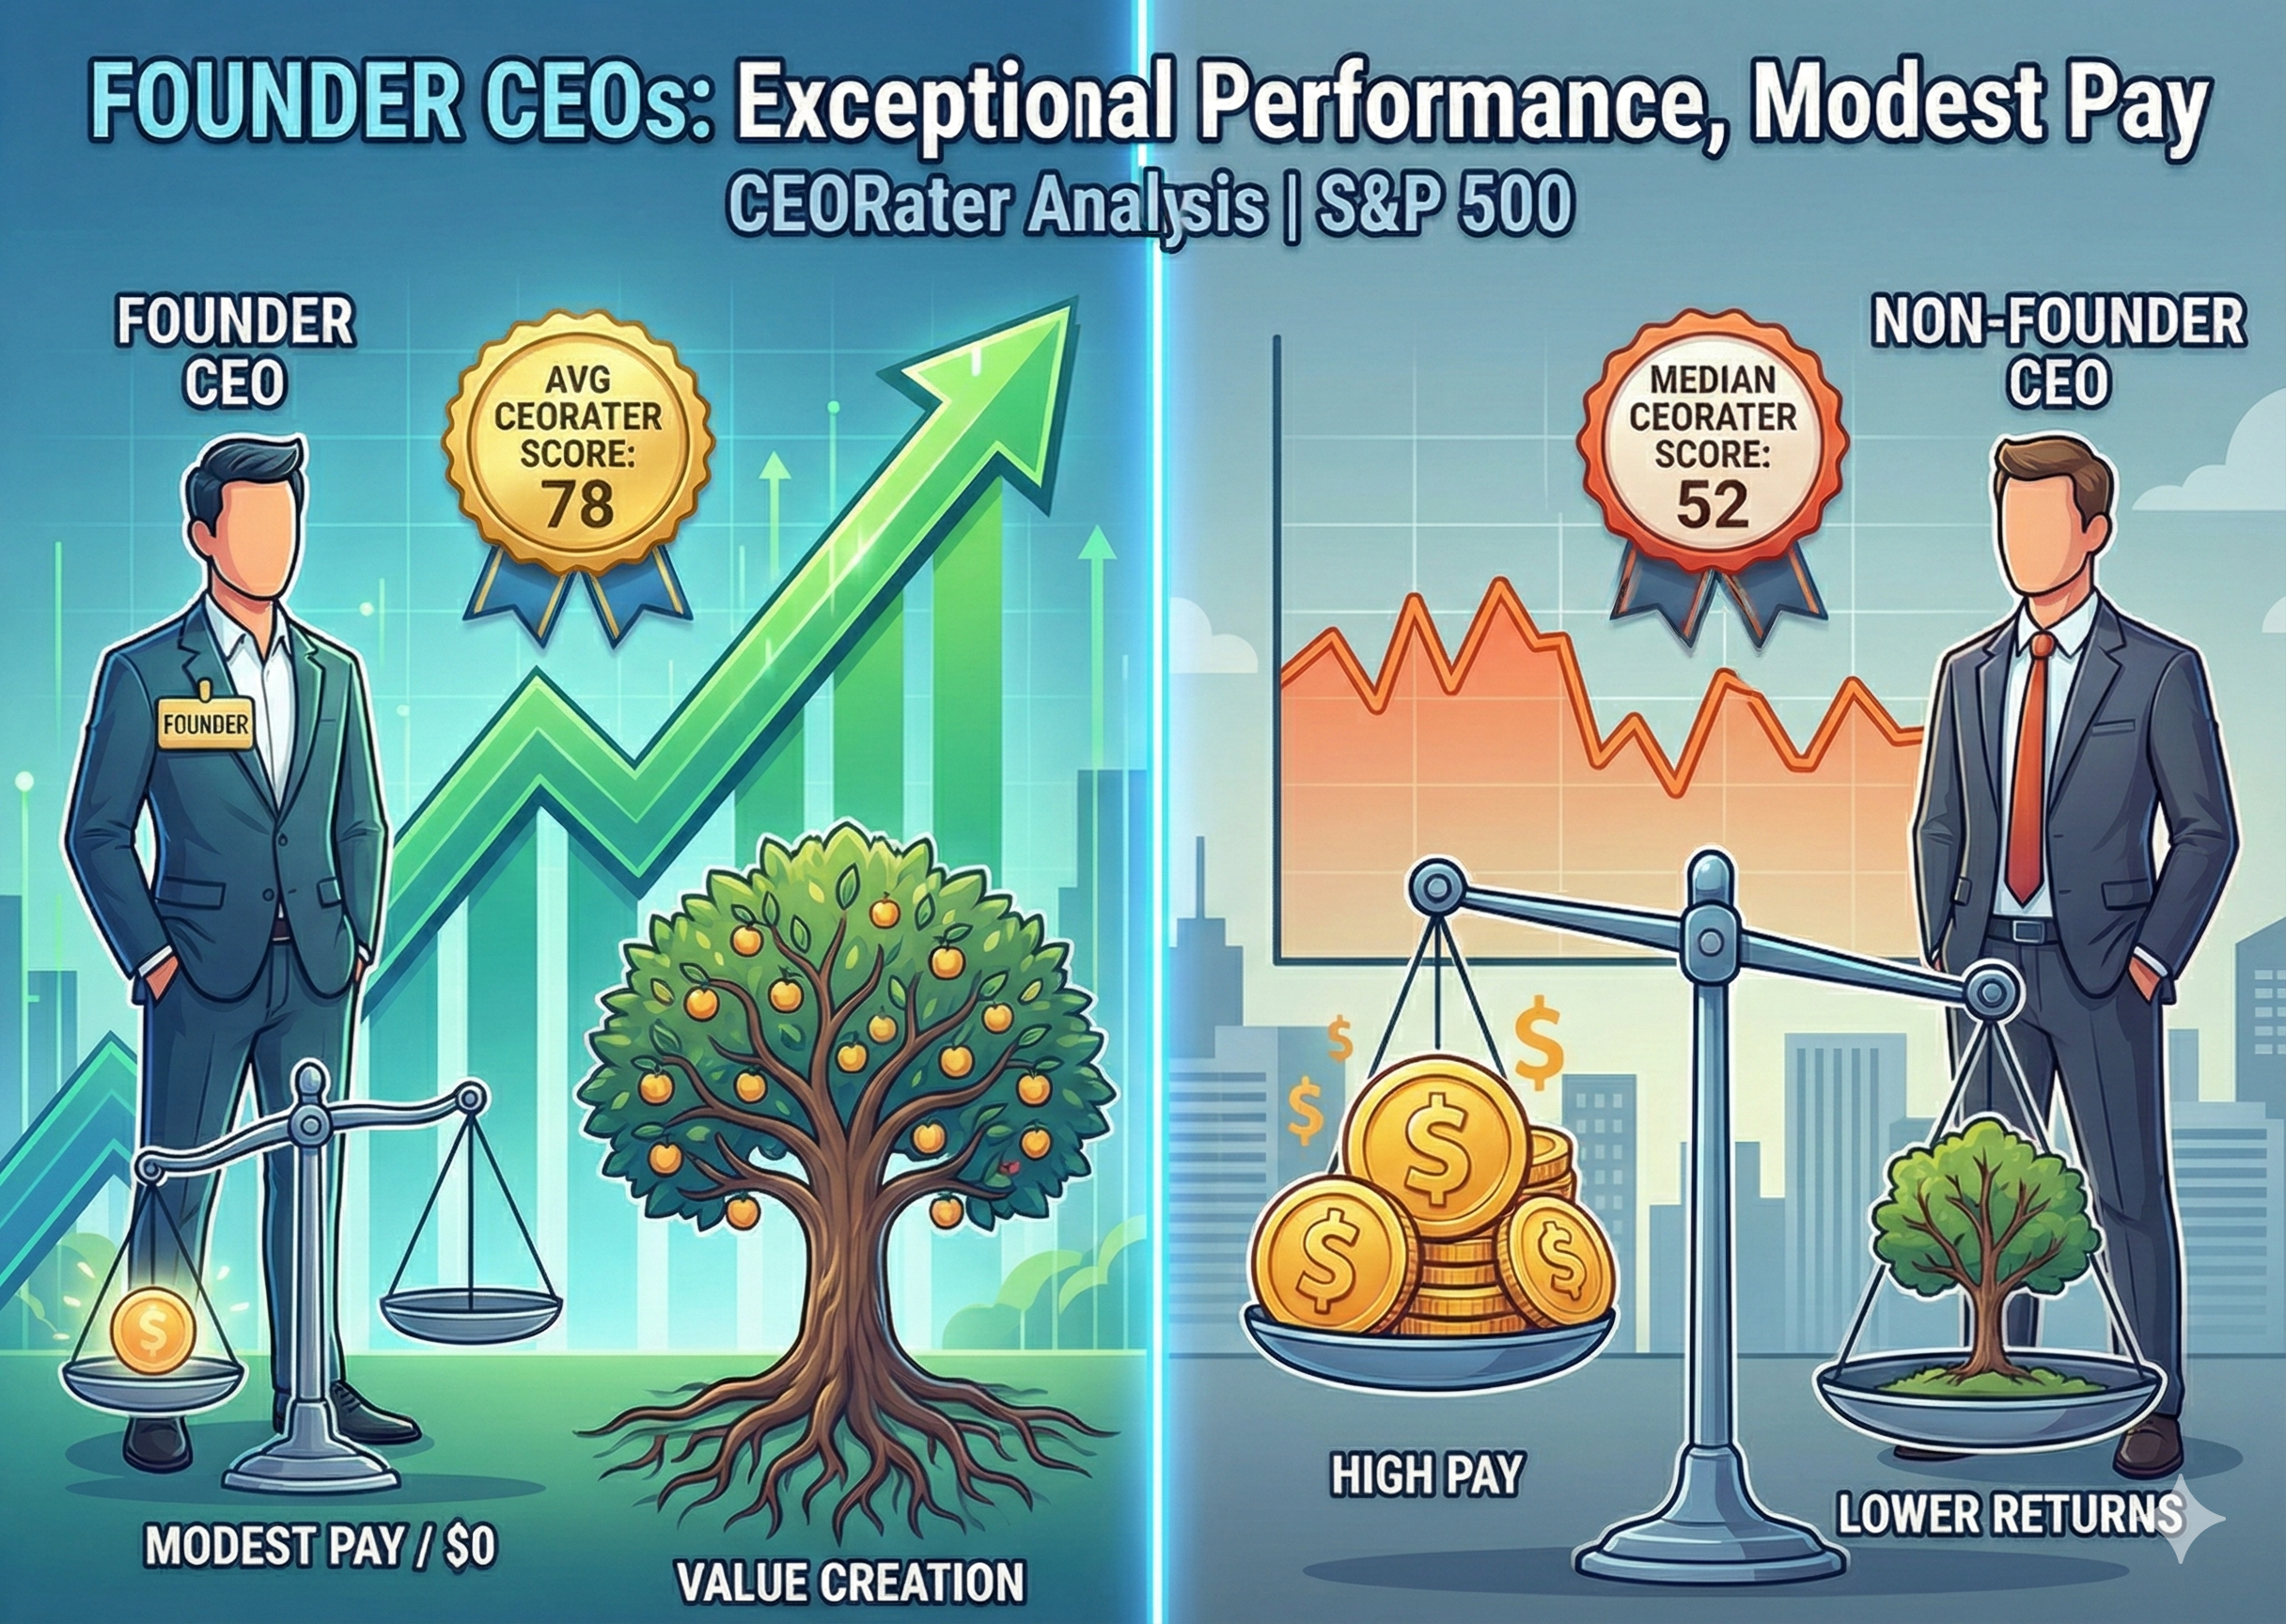
Founder CEOs achieve an average CEORaterScore of 78, dramatically above the median CEORaterScore of 52 for all S&P 500 CEOs. Yet Founder compensation tells a fascinating story of restraint and alignment.
Key Finding: Founder CEOs dominate the A-grade CompScore rankings. Multiple founders take $0 in compensation while delivering exceptional shareholder returns—their wealth comes from equity appreciation, not salary, creating powerful alignment with shareholders.
A-Grade CompScores: The Founder Advantage
Of the 38 Founder CEOs in the S&P 500, a disproportionate number earn A or B CompScores—meaning they deliver exceptional stock returns relative to their compensation cost. Many take minimal or zero compensation, but even those with substantial pay packages achieve top-tier efficiency:
| CEO | Ticker | Company | CompScore | Avg Annual TSR | FY Compensation |
|---|---|---|---|---|---|
| Jensen Huang | NVDA | NVIDIA | A | 17,717% | $49.9M |
| Jay Chaudhry | ZS | Zscaler | A | 64% | $0.0M |
| Jack Dorsey | XYZ | Block | A | 37% | $0.0M |
| Brian Chesky | ABNB | Airbnb | A | 18% | $0.2M |
| Mike Brookes | TEAM | Atlassian | A | 47% | $0.1M |
| Lei Chen | PDD | PDD Holdings | A | 14% | $0.0M |
Notice the pattern: Jensen Huang takes $49.9M—substantial by any measure—but his 17,717% Average Annual TSR earns him a Cost per 1% of just $0.003M. That's an A-grade CompScore despite high absolute compensation. Meanwhile, Jay Chaudhry, Jack Dorsey, and Brian Chesky take essentially nothing, betting entirely on equity appreciation.
Even High-Paid Founders Earn High CompScores
The Founder advantage isn't just about taking $0. Even Founders with substantial compensation packages achieve High CompScores because their returns justify the cost.
Mark Zuckerberg, Meta — CompScore B
Mark Zuckerberg's $27.2M in total compensation carried a B CompScore given Zuckerberg's $0.103M—highly efficient compensation cost per 1% of Average Annual TSR generated.
Understanding CompScore
CompScore measures compensation efficiency—the CEO's total compensation cost per unit of Average Annual TSR generated during their tenure. A grade means highly efficient (low cost per unit of return), while F means poor efficiency (high cost relative to returns). Notice the pattern: founder CEOs cluster at A-grades, while many high-paid non-founders earn D and F grades despite taking premium packages.
The Outlier: Elon Musk
Every pattern has exceptions. Elon Musk of Tesla (CEORaterScore of 85) took $29,516.0M in most recent fiscal year compensation—by far the largest package in the S&P 500. Despite a perfect AlphaScore of 100, this resulted in a CompScore of F.
His Cost per 1% Avg Annual TSR of $14.071M is astronomical compared to peers. While Musk has delivered extraordinary shareholder returns, his compensation package demonstrates how even exceptional performance can be offset by excessive pay—which is precisely what CompScore is designed to capture.
The Contrast: Professional CEOs and the D/F Grade Problem
Professional CEOs cluster heavily in the D and F CompScore grades. The pattern is clear: many command premium compensation packages ($20M-$100M+ in most recent fiscal year) while delivering modest or negative returns.
The most revealing case is Microsoft CEO Satya Nadella. He's delivered an impressive 110% Average Annual TSR—strong by any measure. Yet his $79.1M in most recent fiscal year compensation earns him only a CompScore of D. Why? Because the cost per unit of return is simply too high compared to Founders delivering similar or better returns at a fraction of the compensation.
| CEO | Ticker | Company | CompScore | Avg Annual TSR | FY Compensation |
|---|---|---|---|---|---|
| Brian Niccol | SBUX | Starbucks | F | 1% | $95.8M |
| Lawrence Culp | GE | GE Aerospace | F | 63% | $89.0M |
| Satya Nadella | MSFT | Microsoft | D | 110% | $79.1M |
| David Zaslav | WBD | Warner Bros | F | 3% | $51.9M |
| Julie Sweet | ACN | Accenture | F | 8% | $29.6M |
The pattern is clear: non-founder CEOs command premium compensation packages ($20M-$100M) while delivering modest or negative returns.
What This Means for Investors
The data suggests several actionable insights:
- Look for A-grade CompScores—they indicate efficient compensation relative to returns delivered, and founder CEOs dominate this category
- Founder-led companies tend to deliver superior risk-adjusted returns (average AlphaScore of 77)
- Beware F-grade CompScores—high compensation with mediocre returns is a red flag, regardless of CEO pedigree
- Skin in the game matters—CEOs with significant equity ownership think like long-term shareholders
- High pay ≠ high performance—some of the highest-compensated CEOs deliver below-median returns and earn F CompScores
Explore Founder vs. Non-Founder Performance
Filter CEOs by founder status, compare CompScores, and analyze compensation efficiency across the entire S&P 500.
View All CEO Rankings →Questions about our methodology? Visit our Methodology page for complete documentation on how CEORaterScore, AlphaScore, and CompScore are calculated.